With this product, companies
will be able to place real time information of their production's
processes at the company's web page it's given in a easy and espectacular
way, because this information is getting refresh with the wanted
periodicity, without user having to intercede.
By means of DynaNET®,
users connected to the web pages, will be able to have information
constantly updated without having to refresh the page. Pages have
dynamics graphics and dynamics texts as well as other utilities
detailed below.
DynaNET® allows to automatize the informs
and presentations making and distribution in a easy and effective
manner. Likewise, it can replace others data presentation's
applications.
Also the fact of functioning in a very
extended environment, the web navigator, make that the period
of users's training become the smallest.
The product is able to be used both for
data publication inside of a company
and publicate it over the internet.
The product has
two parts:
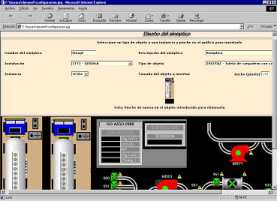
1º The configuration tool:
It's a user's utilities whole for creating
and configurating DynaNET® pages.
System's administrator uses it from his own
navigator and allows him to edit and to incorporate dynamic
data and representations to a web page (new or existing).
For a web page's creation, it's just necessary
to use an easy drawing tool, that is very similar to other programs
ones, for example, the drawing tool of PowerPoint®, and
say which is the represented information's source.
Thus, for example, if user wants to represent
monthly sales in a bar diagram, he just has to insert the wanted
diagram in the web page and fill in its attributes about these
sales.
2.- The display part: It takes
care of the web pages' dynamic refreshing, in a automatic and
transparent way bfor the user.
Some applications' examples:
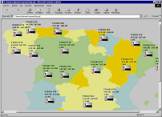
Billing and orders numbers'
publication of a national environment company's.
The numbers are obtained
from corporate data base where the national order salesmen
are bringing sales.
The publication is done over a Spain's map
by bar graphics and assigned numbers to each geographic
area
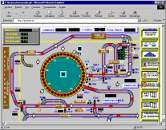
Production line monitoring of a
package factory
Over
a graphic that represents each production line, the next
values are dynamically displayed:
-Line speed
-Produced units
-Stops time
-Alarms advertisement
Data are obtained by
ModBUS communication with the control automaton of the line.
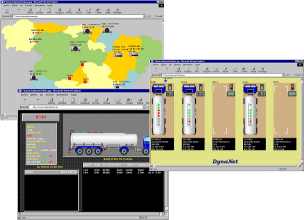
SCADA type application
In a national
range company dedicated to the hydrocarbons products' storage,
the volume, product and temperature of each tank are represented
on a Spain's map.
Obtained data by a tailored
communication done with the control and management system
of the company.
Synptics' creation
tool:
For the creation of synoptics there are a graphic
tool that executes from the own navigator and permits to:
•Incorporate
the synoptic in a new page or as a part of one already existing.
•Select the synoptic size in the page.
•Incorporate as wallpaper any image in standard formats.
•Select Animated Graphics Objects (OGAs) of the proportionate
archive and place it in the wanted place of the synoptic.
•Configurate the OGAs linking them with the process and fixing
their dynamic characteristics (colors, sizes, etc.).
The origin of data that feed to the Web
page can be diverse, from database or file (for example as a spreadsheet)
as an external device communicated with system.
Other part of the tool allows,
depending on selected interface, the configuration of database
that attach process' variables with dynamic representations in
the page.
Graphic elements. Data types:
4 basics data types are handled
in the system:
•
Logics: Stores logic type values, in other words, states "On/Off",
"Start/Stop", "True/False", etc. • Numerics: Stores numeric values. • Texto: Stores alphanumeric
values. • Series (temporals or numerics).
There are 2 types of graphic elements,
these ones that are associated to single data and other ones that
are associated to series.
Single data's OGAs:
Rounds:
•Allows
to select the initial size. •If
it's associated to a logic value, is the filling color which
is assigned to each possible logic states. •If
it's associated to a analog variable, his size varies depending
on the value of the variable. •Allows
to associate simultaneously to both
Parallelograms:
•Allows
to select the initial size.
•If it's associated to
a logic value, is the filling color which is assigned to
each possible logic states.
•If it's associated to
a analog variable, his size varies depending on the value
of the variable. it's possible to associate a variable to
each dimension.
•Allows to associate simultaneously
to both.
Images:
•it's
possible to select any image format (bmp, jpeg, gif,
etc.). •If
it's associated to a logic value,
it's possible to associate a image for each state. •If
it's associated to a analog value, it's possible to
vary his size. •Allows
to associate simultaneously to both.
Tarts.??
•Allows
to select the circumference's size.
•it's
possible to associate several analogs values that forms each
one of the tart's sectors.
•For
each sector, a color and a legend, can be assigned.
Texts:
•If
it's associated to a logic value, it's possible to associate
a text and a color for each states.
•If
it's associated to a numeric one, it's possible to select
the number's representation format.
• If it's associated to
an alphanumeric one, it represents the contents of it.
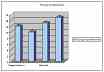
Histograms:
• Bar's graphics •
Allows to select the bar's colors • Allows
to select the separation between bars • Allows
to select the bar's type
Line's graphics:
• Allows to select the graphic
type.
•
Allows to select the color
Lists:
• Present both data in a list style
Standard interfaces:
To be related with real world there are some standard
interfaces without the damage of the development of other newers
ones.
It's possible to have several interfaces working simultaneously.
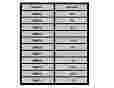
SQL interface:
Designed for the moment when the values' origin are a database
that somehow, unknown for the product, it's being updated.
The administrator user, assisted by the application, configures
the SQL sentence that feeds the real time database.
SQL sentences can be defined aas much as wanted.
In each sentence, user has to provide these data:
Execution's periodicity
ODBC data's source
Columns to select
Real Time database's variables to update
Tables that hold the columns
"Where" sentence.
For example:
Data's sourde: Dinámicos
Periodicity: 10
SELECT: volume, level, density, product, status
INTO: A001,A002,A003,T001,L001
FROM: tanks
WHERE: name = 'ETANOL1
ModBUS
interface:
The data's source is a device that communicates
by this protocol.
The user will fill in the table that links
ModBUS addresses with the real time database's addresses.
Also will fill in another one that configures
the ModBUS acquisition's cycles:
Ciclos:
Addr. Slave
Function
Addr.Start
Total
Period
1
1
0
10
5
Digitals' read
1
3
1000
30
5
Analogs' read
Relationships:
DB RealTime
Type MB
Addr.Start.MB
Total
L001
C
0
10
A001
R
1000
30
OPC
interface:
• It's the natural interface of the real
time.
• The user defines, for each OPC server,
the relationships between his items and real time database's variables
as well as the periodicity:
OPC server
Item
DB Real time
Period
OPCDataControl.OPCServer.1
Tank1.Volume
A001
5
OPCDataControl.OPCServer.1
Tank1.Temperature
A002
30
OPCDataControl.OPCServer.1
Tank1.Product
T001
30
DDE interface:
For the communication with applications by this
technique, the user will define the relationship between DDE
items and real time database's variables
as well as the periodicity.
Tailored interfaces:
Is possible to develop specific interfaces to
satisfy the user requirements. It makes sense specialy in applications
where is necessary to display external systems/devices data
which ones has to be a communication.